
Find leaks before they cost you
Leak Manager gives council teams a live, network-wide view of where water is being lost - ranked by severity, mapped to the field, and connected to the people who can act on it.
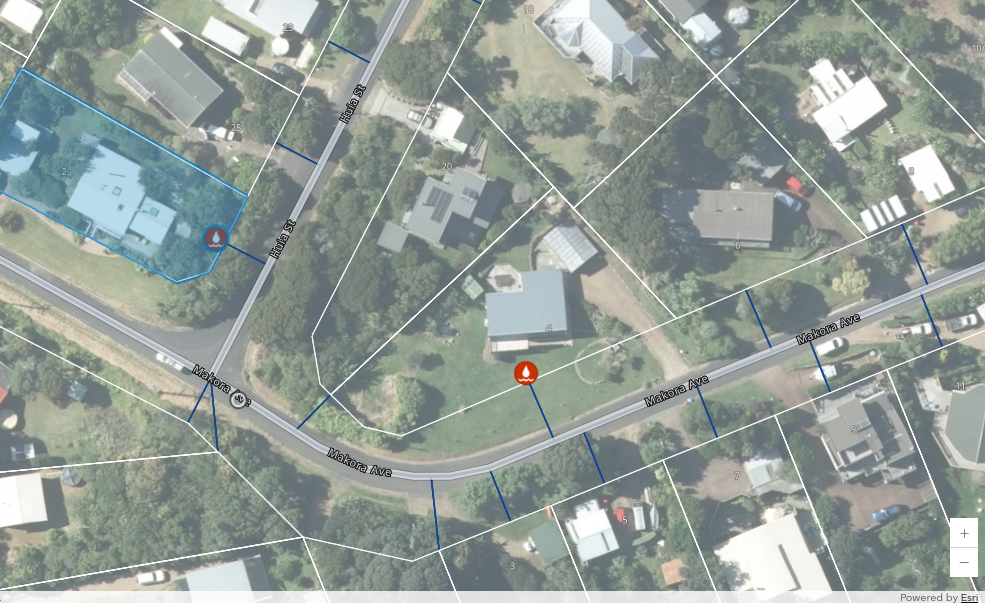
Maps for the field, analytics for the office
Leak Manager comprises two connected components working from the same live meter data: the network leak map, and the new Leak Manager Analytics summary.
Network Leak Map
A live, geospatial view of every leak across the network, colour-coded by severity so the biggest losses are immediately visible.
Leak Manager Analytics
The new summary analytics page: network loss, treatment cost and revenue-at-risk in one view - built for Finance, Reticulation and Contact Centre teams.
Field & Site Visit Tools
Property-level detail for field crews - meter readings, leak rate, severity and revenue impact, ready before they arrive on site.
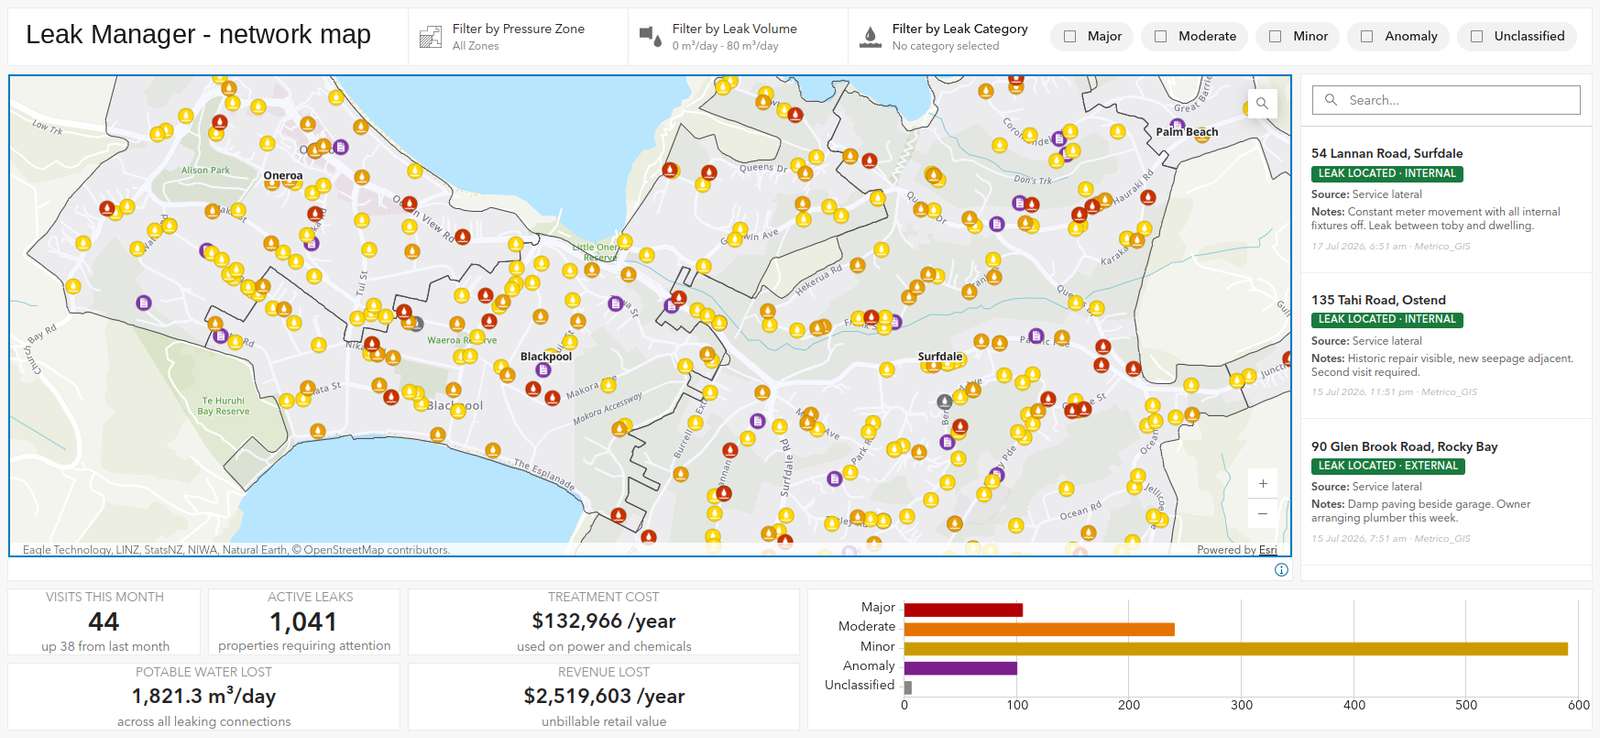
See every leak, ranked by severity
Leak Manager plots every active leak across the network on a live map, with severity-based colour coding so teams can immediately tell where water - and money - is being lost fastest.
- Network-wide leak map with severity filters
- Filter by water supply zone, suburb or severity band
- Drill into any property for detailed leak data
- Updated continuously from live meter data
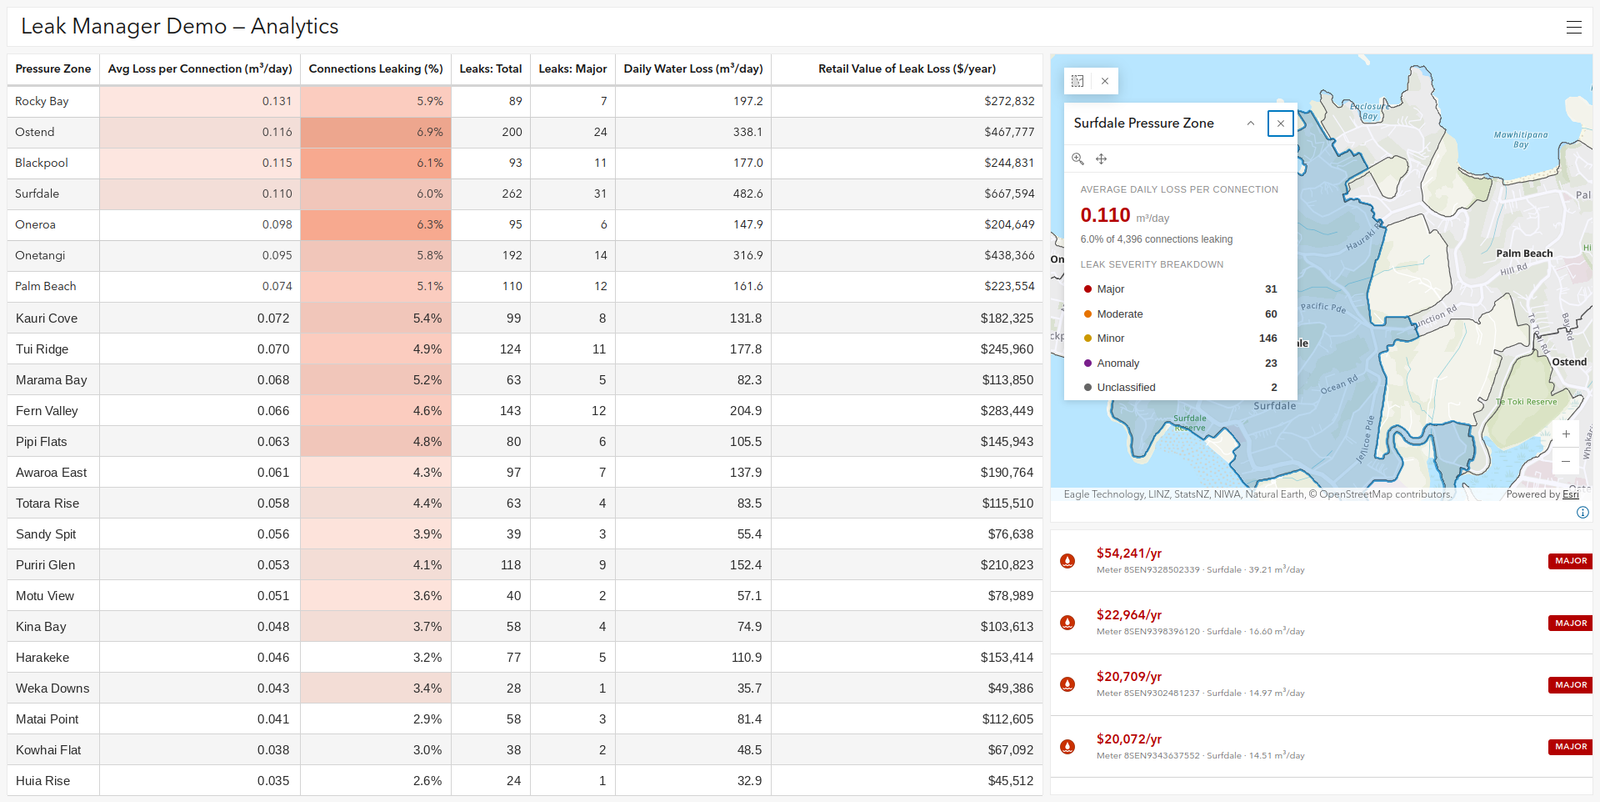
The whole network, on one page
The new Leak Manager Analytics page rolls every active leak up into the numbers that matter to managers: total network loss, the treatment cost of that loss, and the revenue at risk - trended over time and broken down by severity and zone.
- Network loss, treatment cost and revenue-at-risk KPIs
- Trends over time - is the network getting better or worse?
- Breakdowns by severity band and supply zone
- A shared picture for Finance, Reticulation and Contact Centre
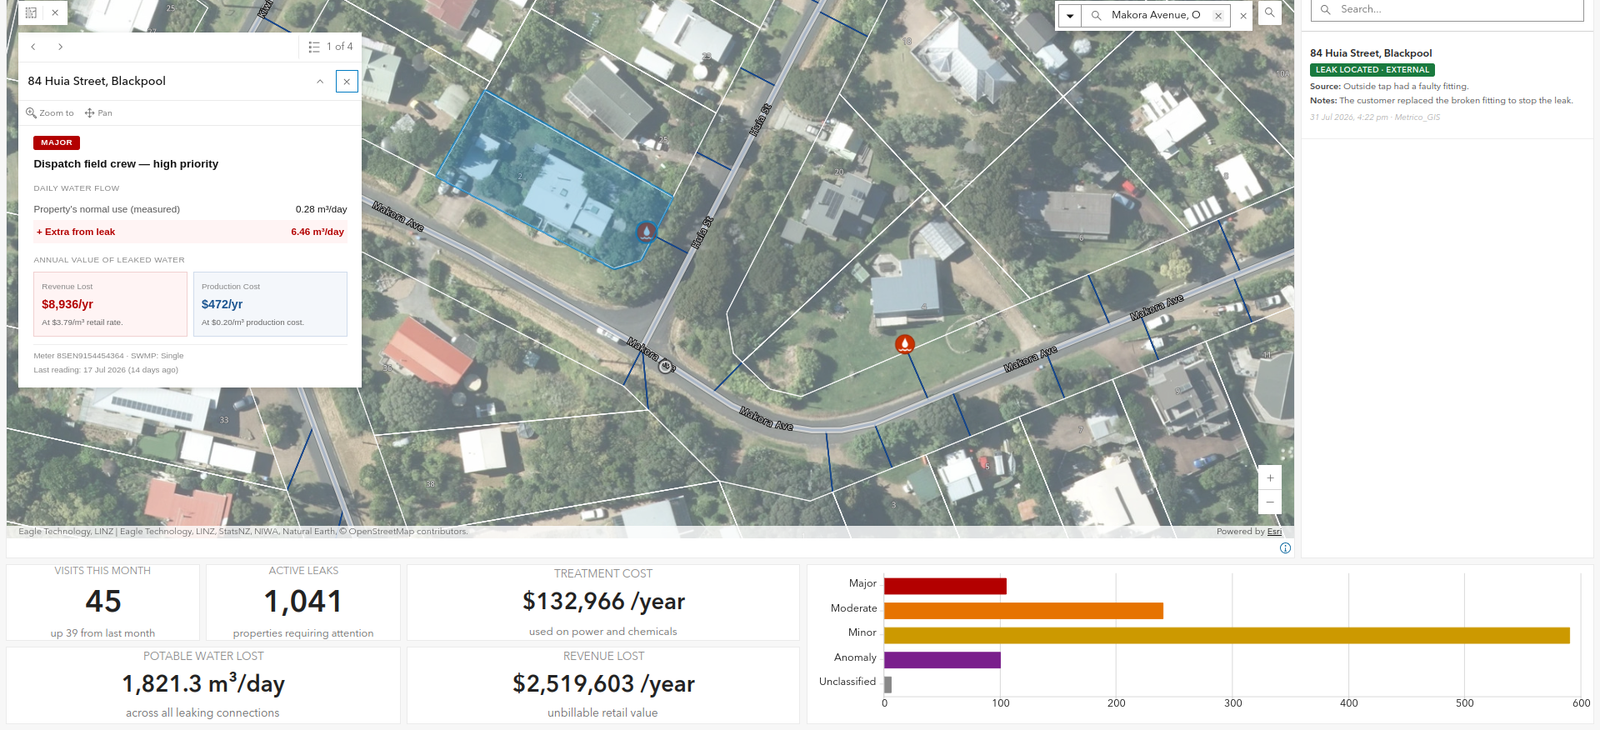
Field-ready detail for every property
Tap any meter on the map to see leak rate, estimated revenue impact and treatment cost - so field crews arrive already knowing what they're dealing with, and why it matters.
- Prioritised view for field crews
- Property-level leak rate, revenue and treatment cost
- Severity classification at a glance
- Supports Contact Centre, Finance and Reticulation teams
Every leak, triaged automatically
Leak Manager classifies every detected leak into one of four severity bands based on leak rate, so teams can focus resources where they'll have the greatest impact.
| Severity | Indicates | Typical Response |
|---|---|---|
| Major | High-volume loss, significant revenue and treatment cost impact | Priority field visit and investigation |
| Moderate | Sustained loss above expected baseline usage | Scheduled follow-up within the fortnight |
| Minor | Small but persistent loss, worth monitoring | Added to routine monitoring list |
| Anomaly | Unusual usage pattern that doesn't fit a typical leak profile | Reviewed for data quality or unusual demand |
Built for the way 3Waters teams work
Leak Manager isn't a generic GIS layer bolted onto a dashboard - it's purpose-built for the workflows of council reticulation, finance and contact centre teams.
Reduce non-revenue water
Identify and prioritise the leaks causing the greatest network loss, so repair effort goes where it has the biggest impact on water loss reduction.
Cut treatment costs
Every litre lost to a leak is a litre that's been treated and pumped for nothing. Targeting the largest leaks first delivers the fastest cost savings.
Recover lost revenue
Leaks on the customer side of the meter mean lost billable consumption. Leak Manager surfaces the properties where intervention recovers the most revenue.
Connect office and field
Contact Centre, Finance and Reticulation teams all work from the same live data - so everyone is acting on the same picture of the network.
See Leak Manager on your network
We can walk you through how Leak Manager works with your council's live meter data - including your own network loss, treatment cost and revenue figures.